
- Category Developer tools
- Available on PC
- OS Windows 10 version 17763.0 or higher
- Keyboard Integrated Keyboard
- Mouse Integrated Mouse
- languages English (United States)
Unlocking Windows Mysteries with WinDbg for Windows
If you're a developer, system administrator, or tech enthusiast diving deep into Windows internals, WinDbg for Windows offers an intriguing peek behind the curtain of your operating system. It's like having a high-powered microscope to analyze and troubleshoot Windows crashes, bugs, and system behaviors—professional tools in the palms of your hands.
Developer and Core Highlights
Microsoft Corporation, renowned for their enduring dominance in the tech industry, develops WinDbg for Windows. This application stands out as a comprehensive debugging tool tailored for Windows environments.
- Advanced Debugging Capabilities: Supports kernel-mode and user-mode debugging, allowing detailed inspection of software and OS issues.
- Crash Dump Analysis: Efficiently processes memory dump files to help diagnose unpredictable system failures.
- Rich Visualization and Console Integration: Combines graphical views with command-line flexibility for nuanced analysis.
- Intelligent Symbols and Extensions: Seamlessly integrates with Microsoft's symbol servers and extensions for enhanced context.
Designed primarily for debugging professionals, the target audience encompasses Windows developers, software testers, security analysts, and IT specialists who aim to uncover elusive bugs or understand system intricacies at a granular level.
Exploring WinDbg in Action
Imagine trying to diagnose a mysterious crash in your Windows app—frustratingly complex, like searching for a needle in a haystack. WinDbg for Windows steps in as your trusty magnifying glass, slicing through confusion with precision and clarity. Its interface melds familiarity with robust functionalities, making complex analyses approachable—even inviting—for those willing to invest in learning its language.
Deep Dive into Debugging Power
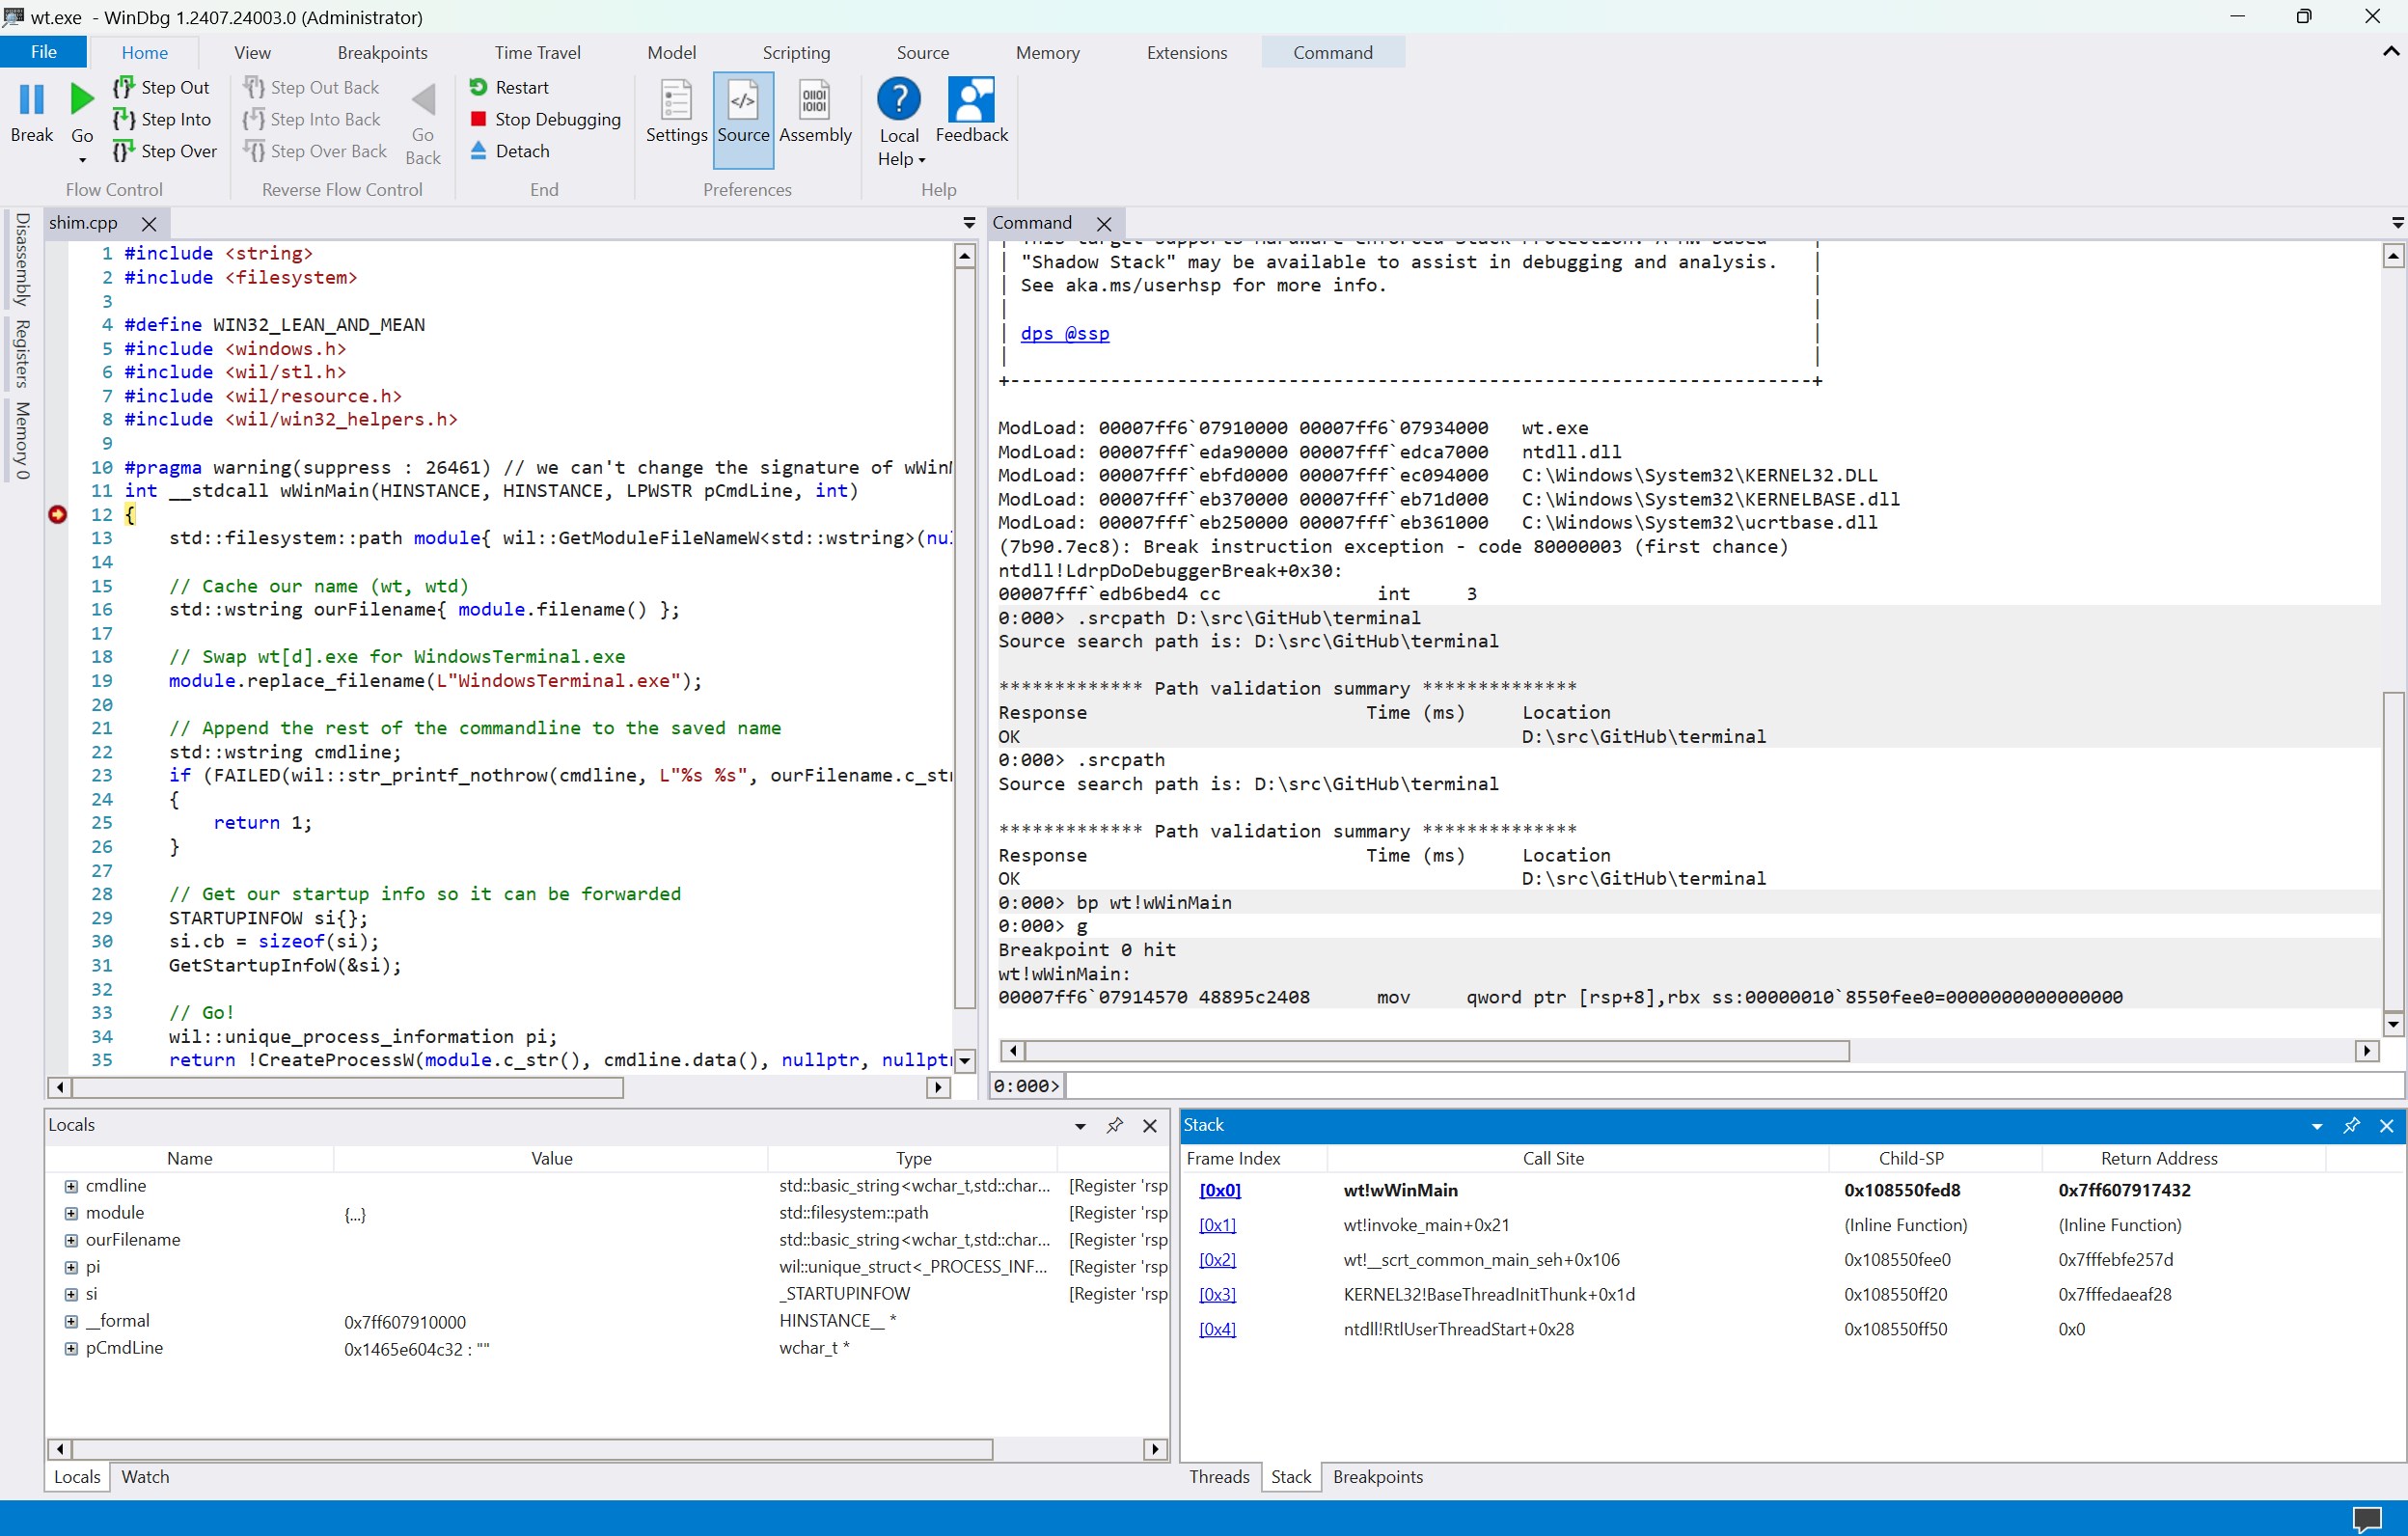
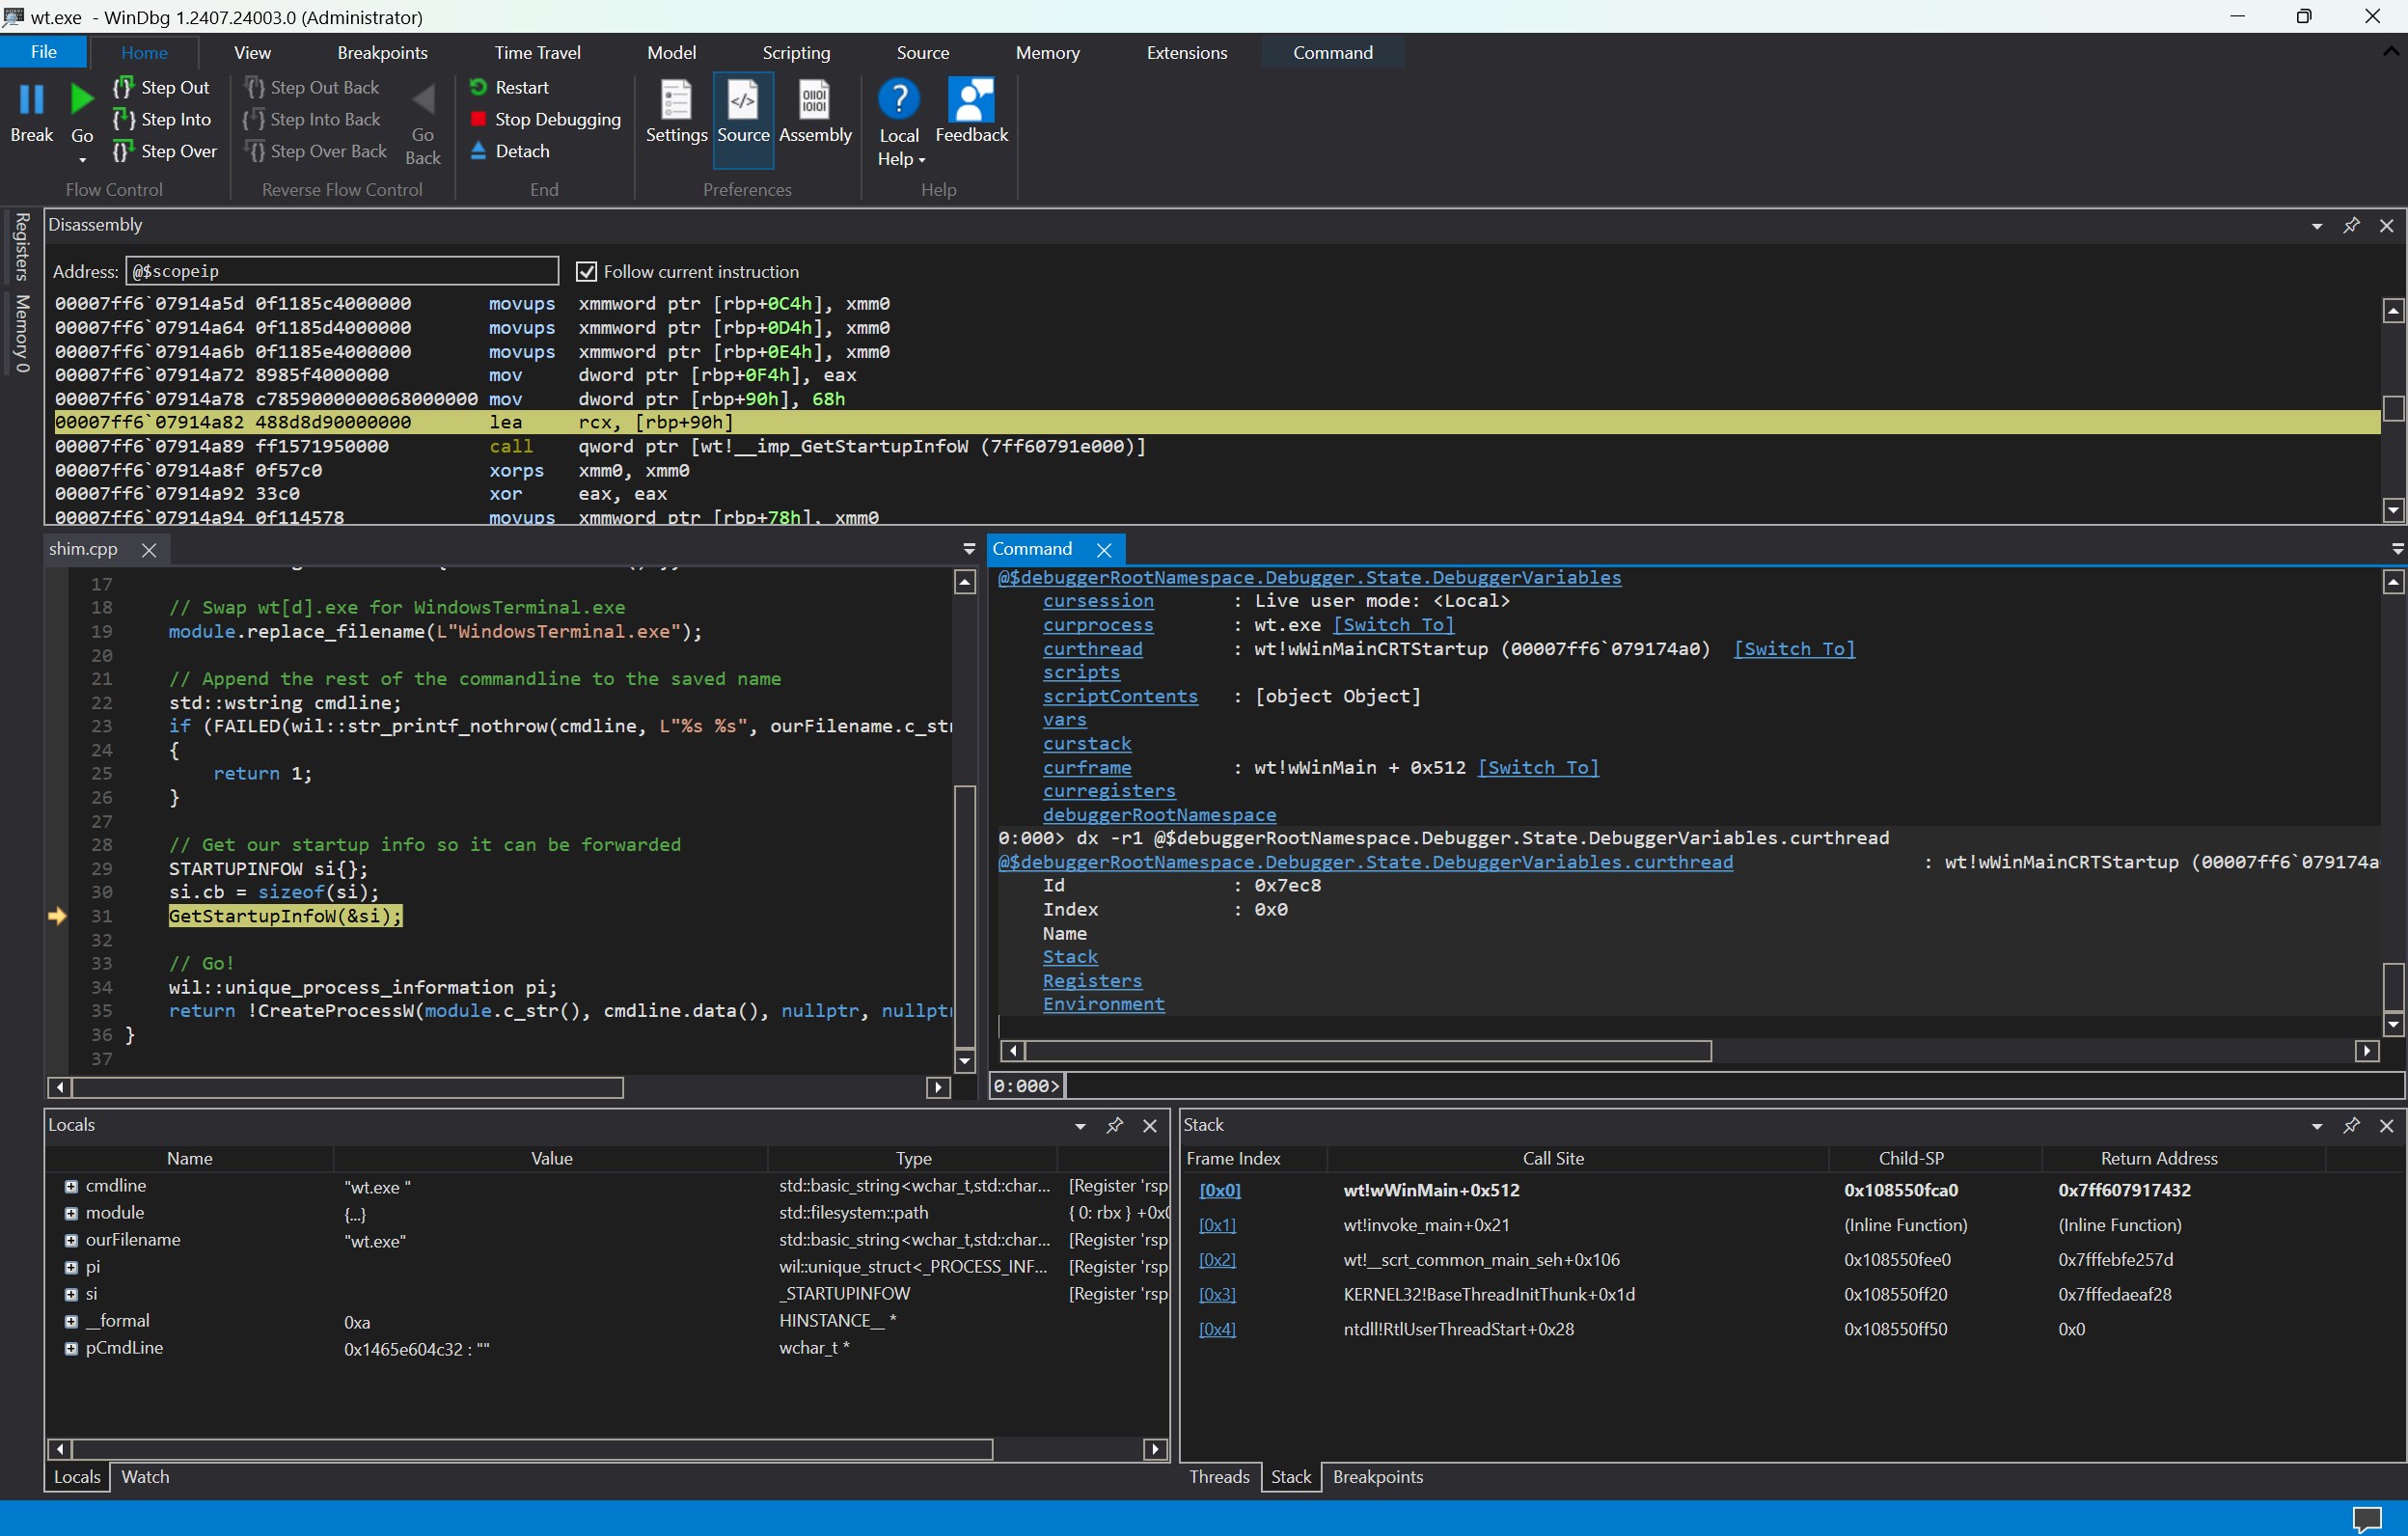
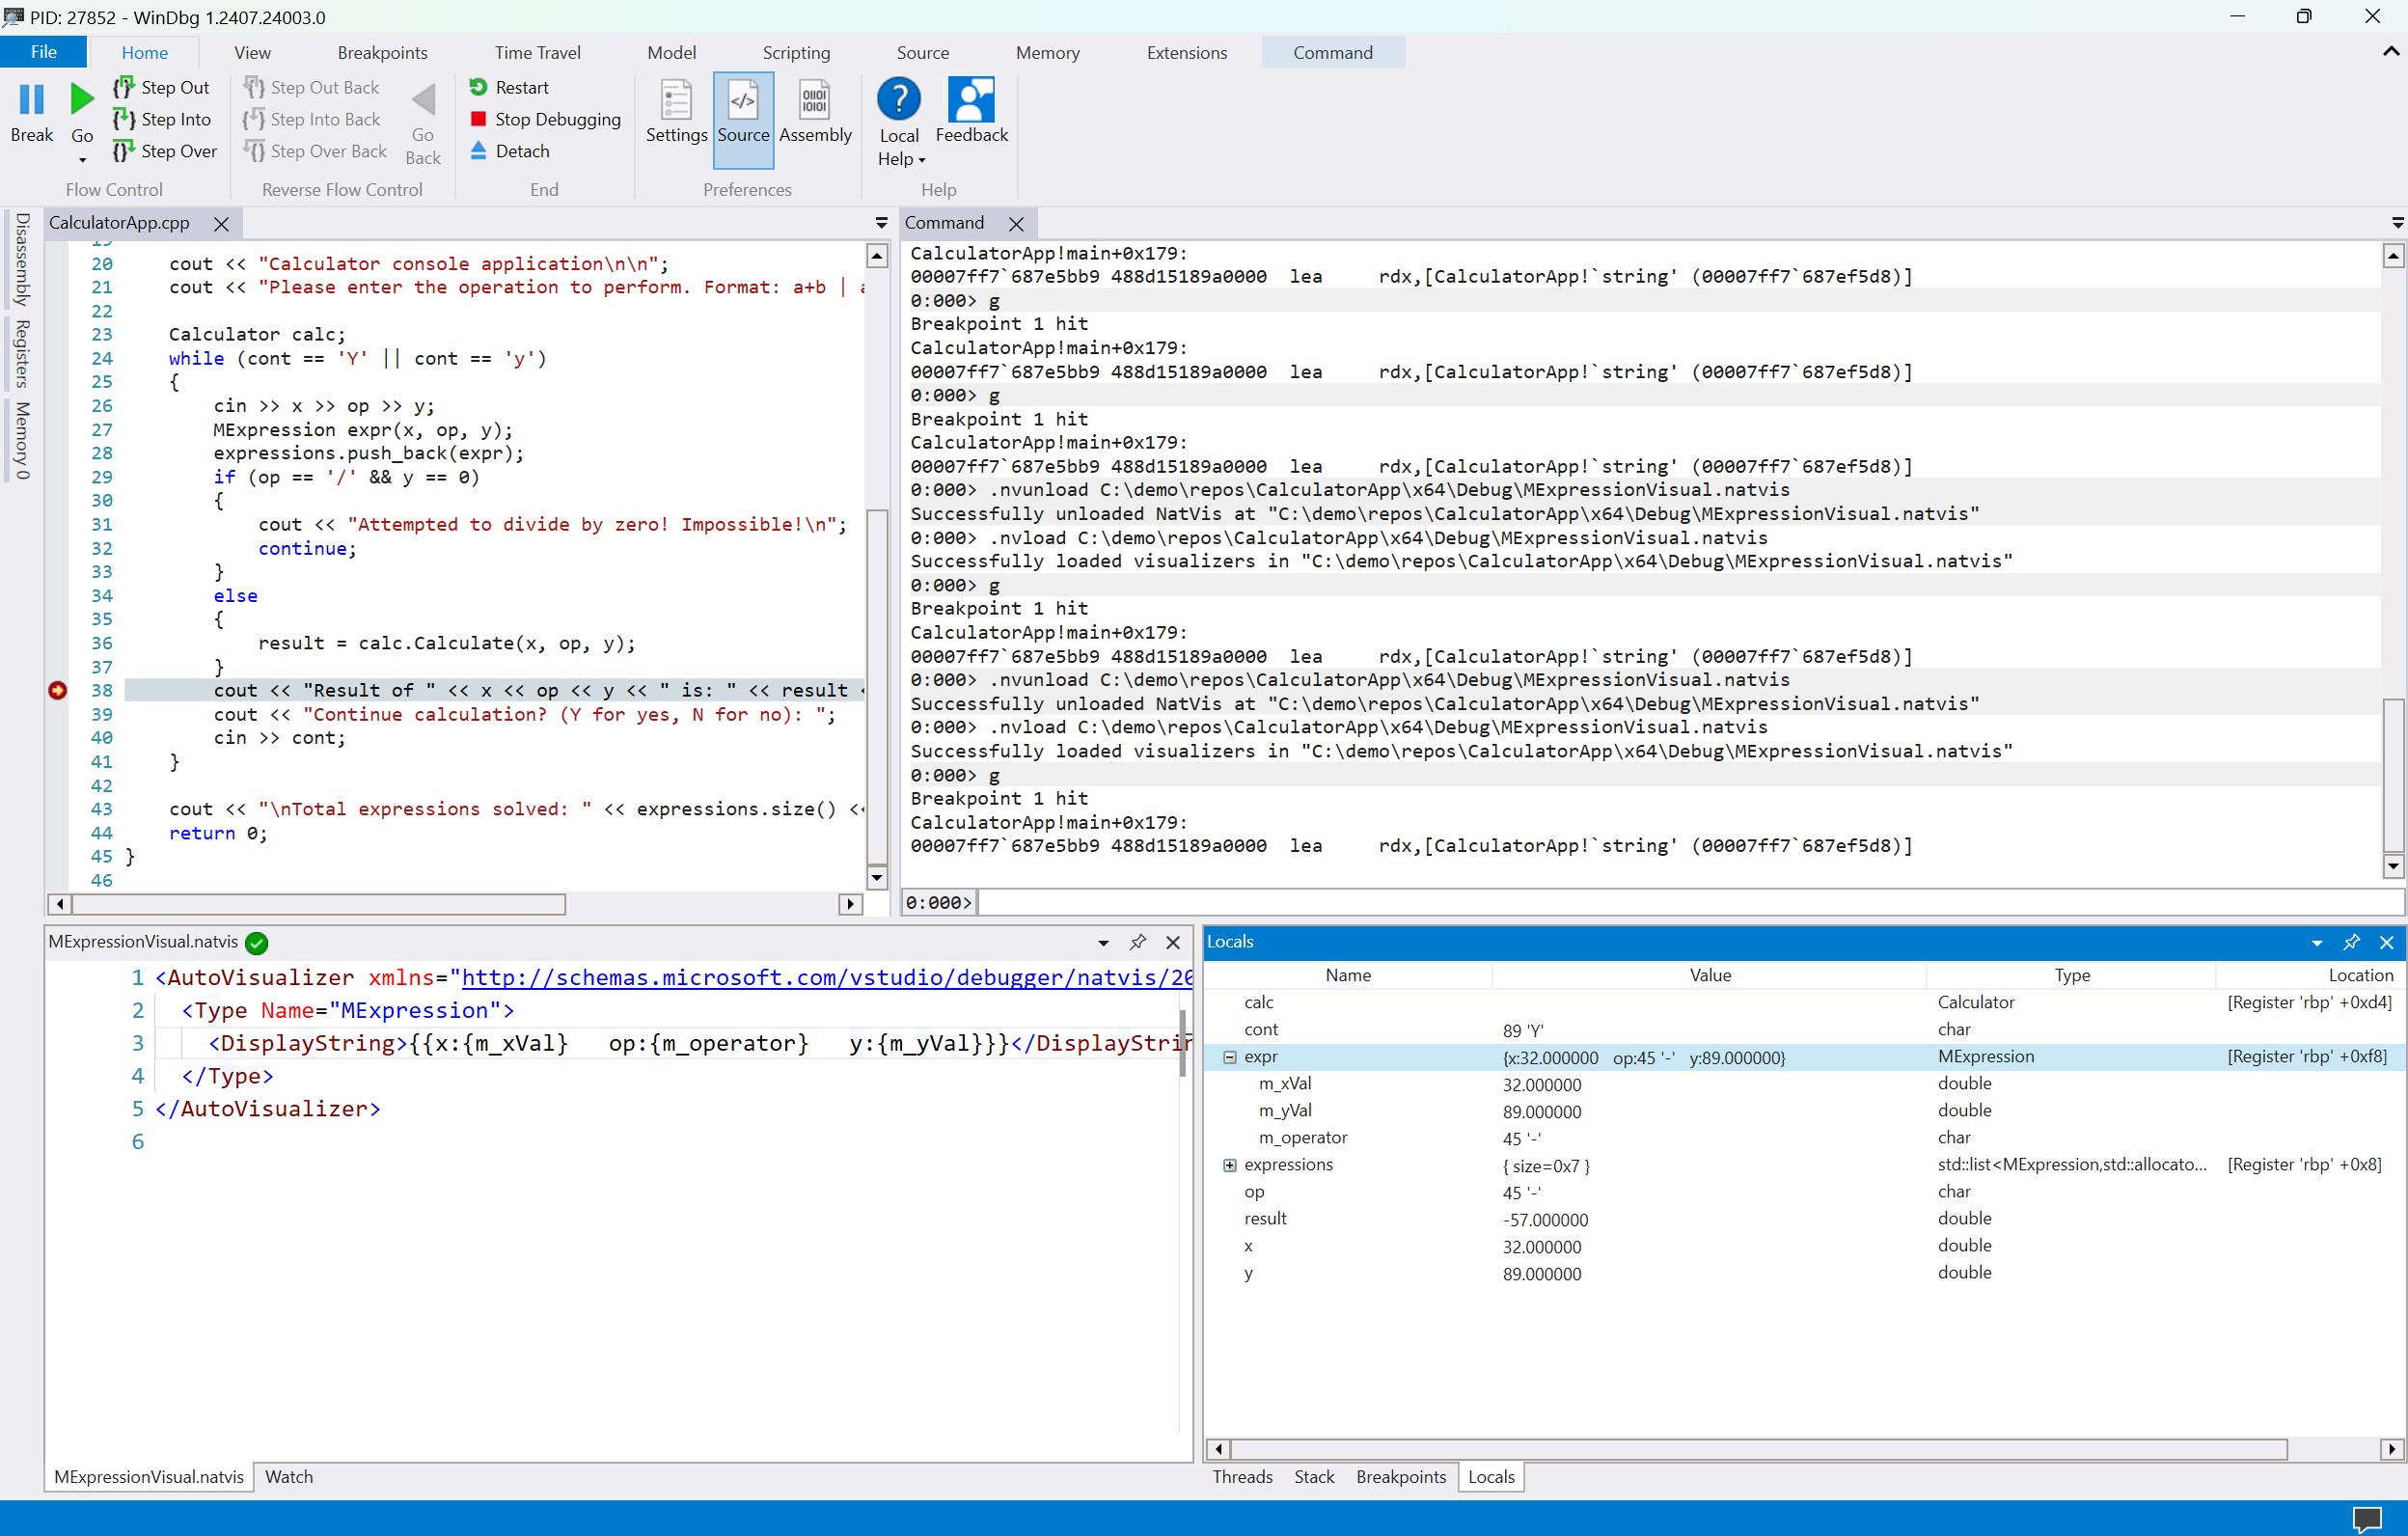
One of WinDbg's crown jewels is its ability to analyze memory dumps. When Windows encounters a blue screen, it produces a memory dump—a snapshot of the system's state at crash time. WinDbg deciphers these dumps with remarkable efficiency, pinpointing the exact driver or module responsible. This feature transforms what could be hours of guesswork into targeted troubleshooting, dramatically saving time and effort.
Additionally, the debugger's support for both kernel and application debugging is a game-changer. It lets you step into the core of Windows or your application code, revealing hidden intricacies like a detective uncovering clues behind the scenes. The ability to attach to live processes or analyze pre-existing logs offers unmatched flexibility, making WinDbg a versatile tool for a spectrum of debugging needs.
User Experience and Interface: Stepping into the Debugging Realm
Bringing together a professional-grade tool with a clean, utilitarian interface, WinDbg for Windows balances complexity with usability. While it's unlikely to become your favorite casual app, the learnability curve is manageable thanks to its logical layout. Navigation feels smooth—perhaps akin to shifting gears in a well-tuned machine—especially when managing large symbols or complex crash dumps. Power users will appreciate the contextual help and extensibility options, helping them customize their workflow.
That said, new users might find the interface somewhat daunting initially. The multitude of panels and command options is reminiscent of a cockpit—rich in features but requiring familiarization to master. But for those committed to the debugging craft, this initial investment pays dividends in resolving stubborn issues efficiently.
What Sets WinDbg Apart?
Compared to other developer tools, WinDbg's foremost distinction is its unparalleled depth of system insight—black and white, raw, unfiltered access to Windows internals. Its support for modern debugging scenarios, including live kernel debugging and remote debugging, make it a standout. Importantly, its tight integration with Microsoft's ecosystem—symbol servers, extensions, and documentation—ensures users have authoritative references at their fingertips. In essence, WinDbg isn't just a debugger; it's a window into the heart of Windows troubleshooting, unmatched in capability.
Verdict & Recommendations
Given its comprehensive feature set, WinDbg for Windows is suited for those serious about Windows troubleshooting or development. It's an essential tool for diagnosing complex system crashes and analyzing system behavior at a granular level. While the learning curve might be steep for absolute beginners, the depth of insights and diagnostic precision justify the effort.
My recommendation? If you are comfortable with command-line interfaces, eager to enhance your debugging arsenal, and willing to invest time into learning its nuances, WinDbg for Windows is an excellent choice. For casual users or those seeking quick fixes, a more user-friendly GUI-based debugger might be preferable. However, for in-depth analysis that demands full control and insight, WinDbg remains unparalleled.
Pros
- Powerful debugging capabilities
- Comprehensive support for various debugging scenarios
- Extensive scripting and automation features
- Integration with Windows debugging tools
- Active community and detailed documentation
Cons
- Steep learning curve for beginners
- User interface is somewhat outdated
- Requires significant system resources
- Documentation can be complex for new users
- Limited support for non-Windows platforms